

Alibaba: Too Big To Fall

Summary
- Over the past year, Alibaba has been hit by a flood of negative news and actions from China’s regulatory authorities.
- Alibaba shares are in a long fall and have lost around 37% of their highest historical level. The main reason for such a strong fall is fears of investors.
- Alibaba is a huge global company with good financial indicators and development prospects. The company’s business is growing, revenues are raising and strategic investments are continuing.
- My DCF valuation model showed a 44% upside potential with the target price of $283. It is good short-term (or mid-term) investment, but the long-term potential is uncertain.
Investment Thesis
For several months in a row, Alibaba Group (BABA) was a subject of pressure from the Chinese government. This has had a strong impact on the stock price, and now they are trading 37% less than the historical maximum. All these problems are significant, however, it is difficult to justify such a strong dip in the share price.
At the moment, the shares show a very high undervaluation. My DCF model showed an underestimation of 44%. According to it, Alibaba’s fair price is about $283 per share. Alibaba has many merits, but also some drawbacks, which are discussed in the article. Despite the problems, the current price level is very attractive for a short-term investment.
What Happened to Alibaba?
Alibaba is one of the largest Chinese companies known all over the world. In addition to this, it is also one of the largest companies on the global stock market. The shares of this constantly growing company have started to show a steady decline over the past 10 months. And just recently there was another shock. The reason for everything is constant pressure, fears, and uncertainty.
The sad fairy tale began in the fall of 2020 when the Chinese government suspended the IPO of Ant Group. At the same time, the founder and one of the members of the board of directors, Jack Ma, disappeared. Later, in December of the same year, an antitrust investigation was launched. After that, they recovered a little, and in April 2021, the amount of the fine for violating the antimonopoly legislation was announced. The company had to pay $2.8 billion in two payments.
Afterward, there were various events that dramatically affected Alibaba’s shares price. One of the most significant is that the government was forcing the company to sell the media assets worth $8 billion in mid-March.
Recently, two more important events happened that could not but affect the stock price. The Chinese authorities have become very concerned about the state of the industry. Their goal is to increase competition and give opportunities for the development of small businesses and IT startups, to ensure reliable protection of user data. But this does not benefit Chinese public companies and has greatly affected the price of their shares. This was immediately followed by a ban on private tutoring, which showed the limitless power of CCP over local businesses.

All these events have instilled uncertainty in investors about the future of Alibaba. It is difficult to assess the possibility of new sanctions from the CCP. Recent events have shown that it is unknown what can be expected. However, despite what happened and the risks inherent in Alibaba, the company has strong financial indicators and continues to grow.
Business Overview
Alibaba Group is a diversified holding, which includes several large businesses and many small ones. The key feature of the company is that most of them are interconnected and form a high-quality ecosystem.

Source: Alibaba Group Annual Report 2021
The key business is internet retail. Alibaba has more than 912 million annual active customers in China and more than 265 million in the rest of the world. Other areas of business bring less income, but they are extremely important for the full functioning of the ecosystem. The following is the revenue breakdown.
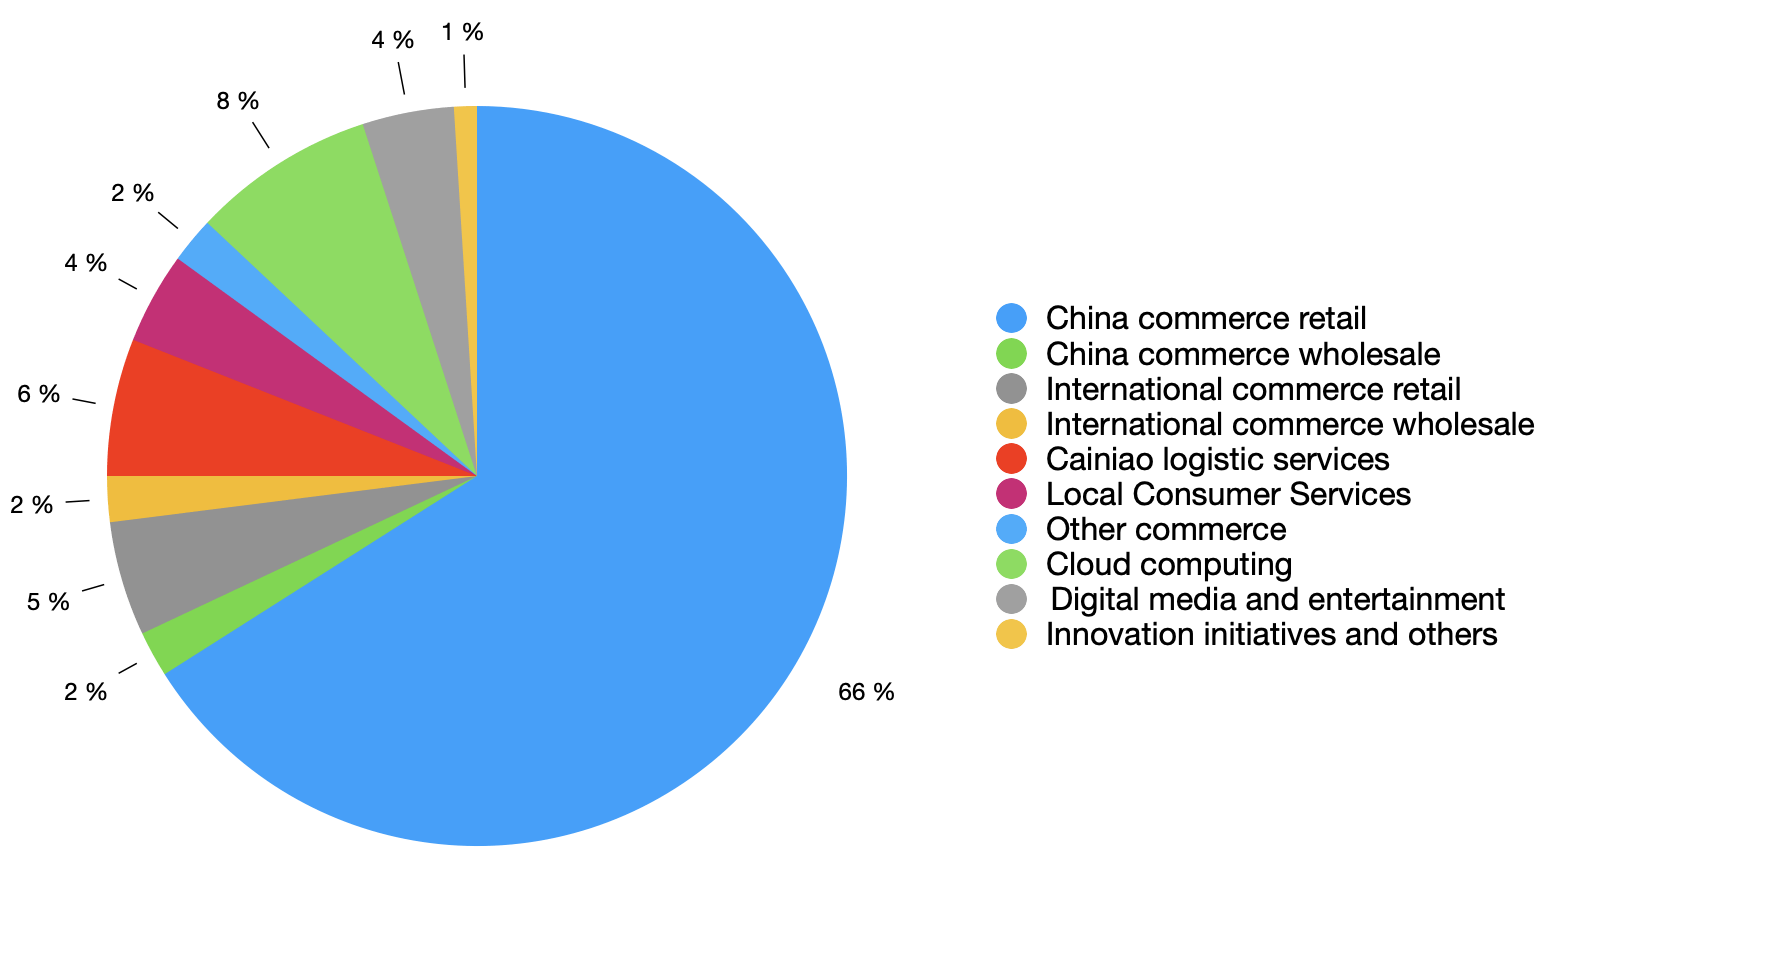
Source: Alibaba Group June Quarter 2021 Results
Alibaba is one of the largest companies in the international commerce market. Mostly, the companies of this industry focus on domestic markets. The Chinese market is huge and Alibaba is one of the key players there. However, the company is not focusing only on the domestic market but also on an international one.
Financials: A Steady Growth Story
Alibaba recently published a financial report for the June quarter of 2021. The report didn’t beat analysts’ expectations, but there were some positive signals. The key points of the reporting are a decrease in Adjusted EBITDA and Net Income. The company explains that investments in strategic areas in order to capture incremental opportunities contributed to the decrease in operating profit. And the decrease in net profit was affected by the partial payment of a fine for violation of antimonopoly legislation.
| Indicator, RMB MM | June 2020 | June 2021 | YoY% |
| Revenue | 153,751 | 205,740 | 34% |
| Adjusted EBITDA | 51,039 | 48,628 | -5% |
| Net Income (incl. Minority Interest) | 46,437 | 42,853 | -8% |
Source: Alibaba Group June Quarter 2021 Results
During the year, the largest growth was shown by the retail trade of international trade and logistics services of Cainiao, which amounted to 54% and 50%, respectively. The total commerce revenues raised by 35%. Innovation initiatives segment and cloud computing showed a decent performance increased by 37% and 29% respectively. Digital media and entertainment showed a growth of only 15%.
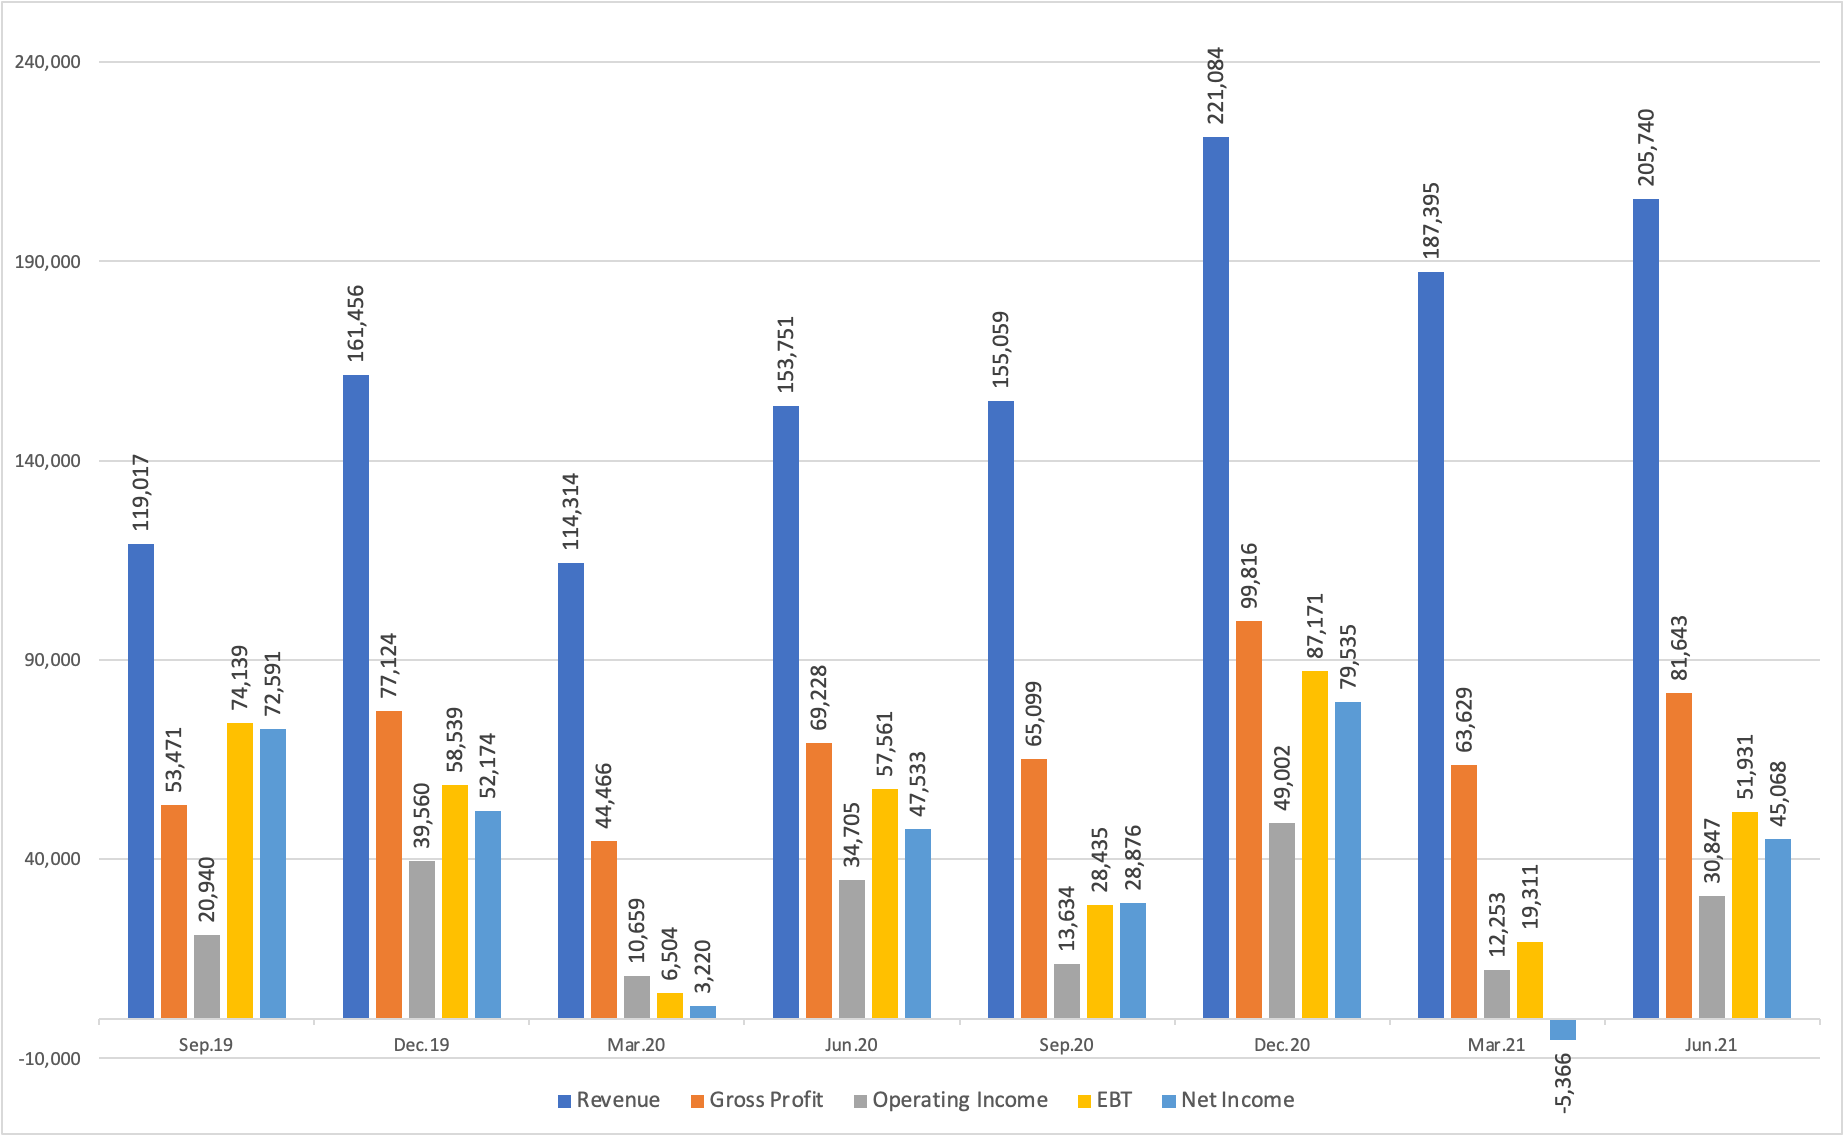
Source: created by the author using data from TIKR.com
The seasonal dependence of revenue growth is obvious. Probably, the lower revenue growth in 2021 than in 2020 is due to a smaller decrease in March 2021, compared to 2020.

Source: created by the author using data from TIKR.com
The picture of annual earnings is more interesting. The company managed to significantly increase its revenue and revenues over the past 10 years. But during recent years, there has been a slowdown in the growth of operating and net profits. The figures for 2021 do not include the values for the second quarter, since Alibaba ends the fiscal year in the first quarter. Also, there is no obvious retrospective trend towards revenue growth.
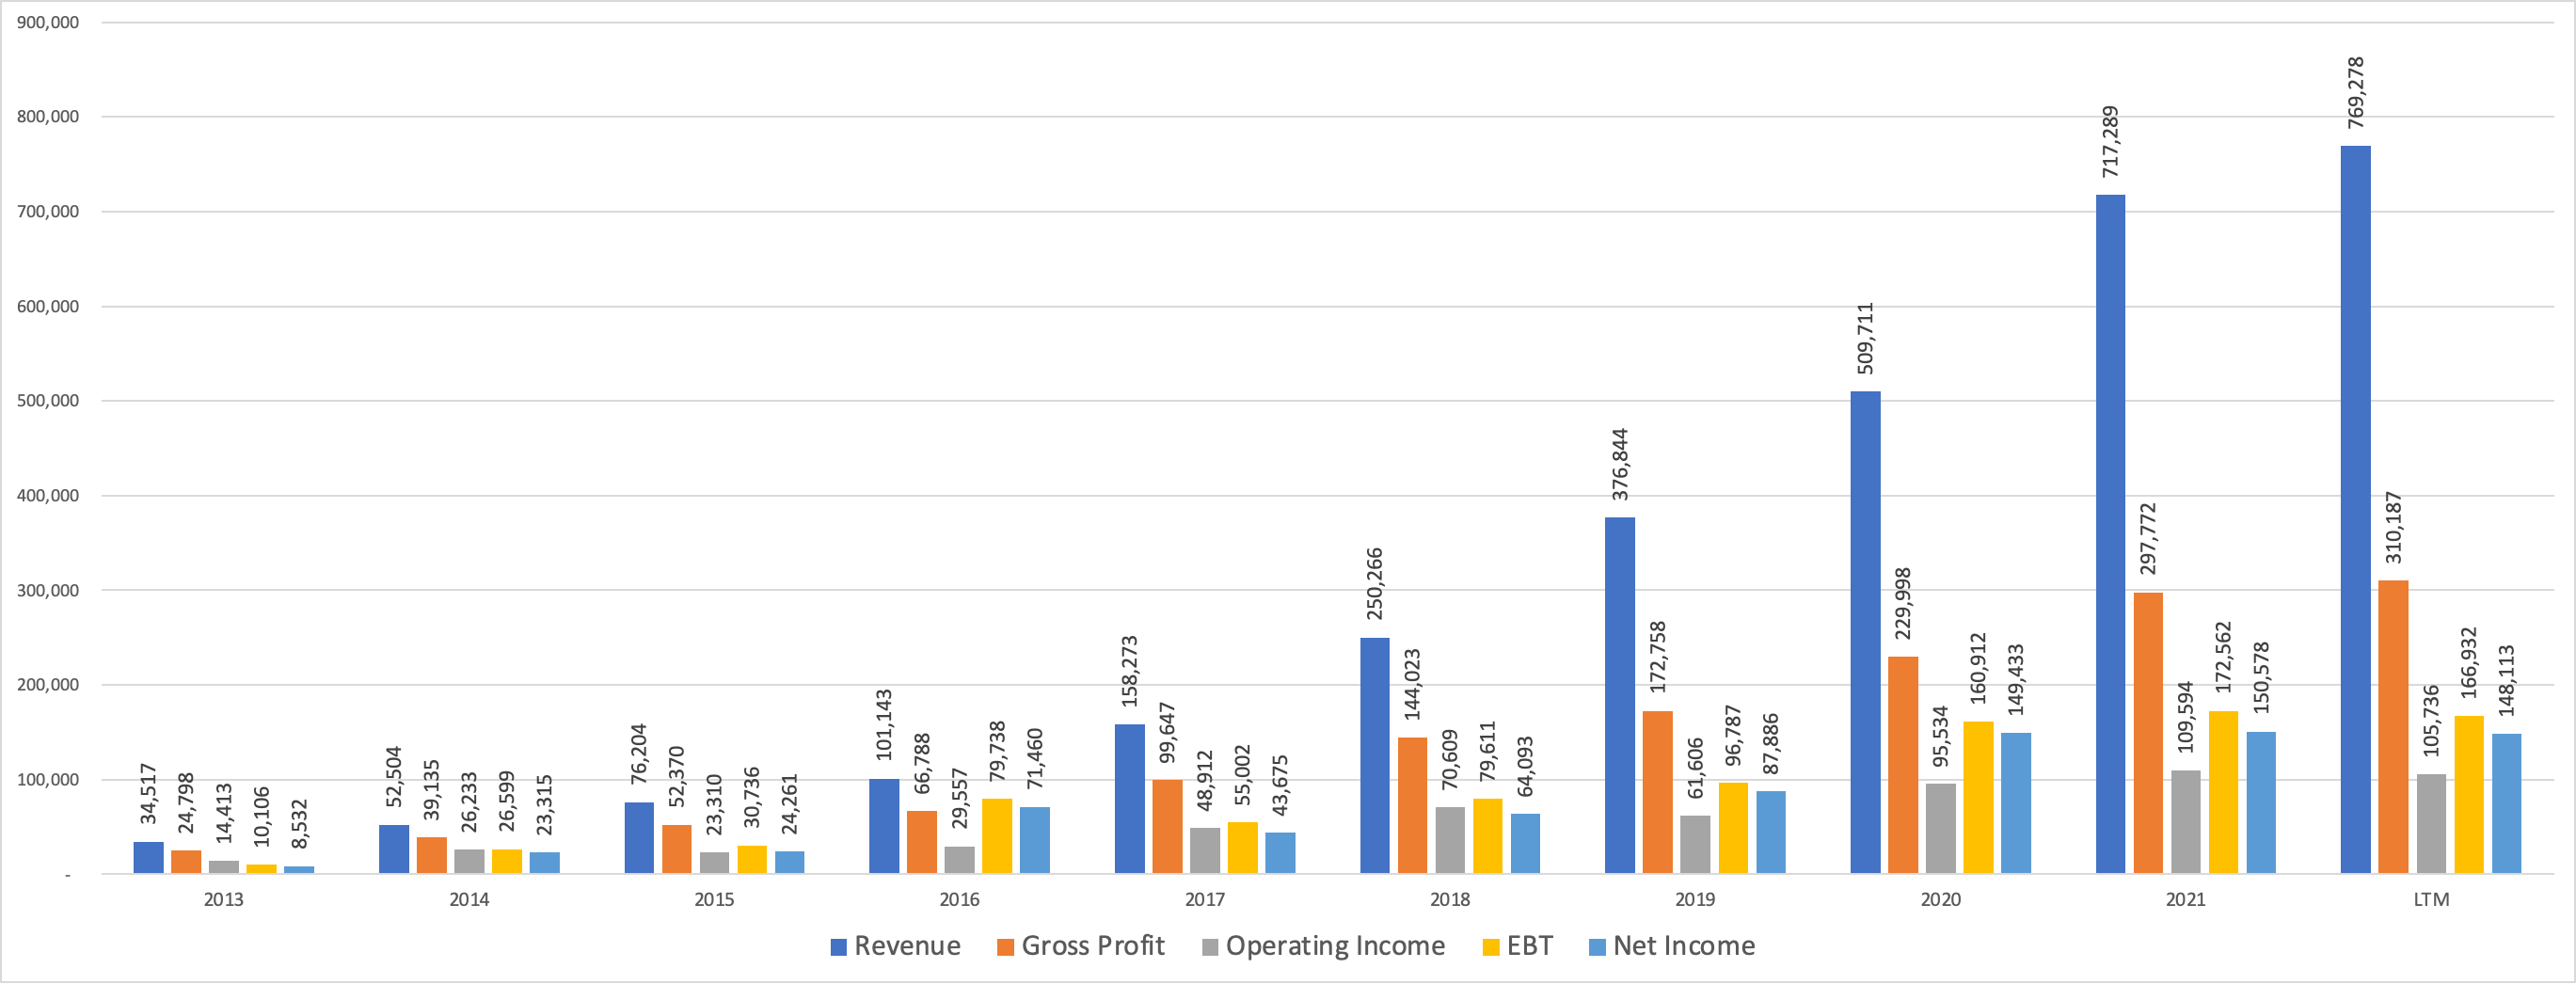
Source: created by the author using data from TIKR.com

Source: created by the author using data from TIKR.com
The profitability analysis does not show the best picture. The decrease in operating margin and net margin is provided by a constant increase in R&D expenses. The rapid growth of revenues is accompanied by an increased increase in the cost of sales, in particular, marketing expenses increased by more than 100% over the year. The company isn’t paying any dividends, so growing investments are a positive signal for the company. Due to the strong flow of operating profit from the commerce sector, Alibaba can maintain a good pace of development of unprofitable sectors. Cloud computing, digital media, and hardware could reach zero profit within the next few years.

Source: created by the author using data from TIKR.com
In general, the indicators of Ali Baba’s financial statements can be called satisfactory. As mentioned above, this is not the best long-term investment. Financials confirms this statement: the growth rates of income and profitability are decreasing. This picture should not frighten short-term investors. But if nothing changes in a long term, it might grow into a serious question.
Comparison With The Peers
To perform a relative analysis, I selected 15 companies from the internet retail industry (including Alibaba) with a market capitalization of more than $10 billion. Alibaba was compared to these companies by financial ratios and multipliers.
Following companies are included in Alibaba’s peer group: Amazon (AMZN), JD (JD), Pinduoduo (PDD), MercadoLibre (MELI), Coupang (CPNG), Carvana (CVNA), eBay (EBAY), Chewy (CHWY), Wayfair (W), Etsy (ETSY), Farfetch (FTCH), Vipshop (VIPS), Global-e (GLBE), Ozon (OZON). These companies operate in local or global consumer e-commerce markets.
Ratios comparison
Alibaba’s competitors include many companies at an early stage of development. Their income growth indicators are slightly higher, however, profitability ratios are worse. The table also shows several companies at a late stage of development (including mature ones). Among them, Alibaba’s ratios seem OK.
| Ratio (LTM) | Amazon | Alibaba | JD | Pinduoduo | MercadoLibre | Coupang | Carvana | eBay | Chewy | Wayfair | Etsy | Farfetch | VipShop | Global-E | Ozon |
| Market Capitalization, bn $ | 1841.94 | 548.2 | 113.7 | 111.81 | 93.18 | 71.8 | 58.38 | 49.33 | 39.55 | 31.23 | 25.14 | 16.75 | 12.09 | 10.59 | 10.77 |
| ROA | 9.20% | 9.80% | 13.30% | -4.70% | -0.20% | -7.95% | -4.90% | 10.02% | -0.40% | 10.70% | 21.70% | -89.20% | 12.50% | 5.13% | -11.22% |
| ROE | 29.90% | 17% | 31.30% | -13.20% | -1.10% | 142.27% | -36.60% | 91.08% | 6.40% | -39.90% | 73.60% | 527.80% | 24.70% | 8.79% | -62.95% |
| ROI | 13.90% | 1.40% | 5.40% | -12.30% | 1.50% | 18.20% | -21.90% | 15.80% | 4523% | 23.20% | 21.20% | 59.50% | 15.90% | -18.50% | -16.80% |
| Gross Margin | 40.70% | 41.30% | 14.40% | 62.50% | 42.30% | 16.60% | 14.80% | 75% | 26.50% | 29.50% | 74.40% | 45.20% | 20.90% | 32.60% | 2.00% |
| Operating Margin | 6.70% | 12.50% | 1.50% | -12.20% | 5.30% | -4.83% | -5.40% | 27.05% | 0.00% | 4.20% | 26.00% | -34.50% | 5.90% | 8.03% | -16.20% |
| Net Margin | 6.60% | 21.00% | 6.50% | -7.90% | -0.30% | -5.24% | -2.20% | 25.94% | -0.10% | 3.20% | 23.50% | -150.87% | 6.10% | 0.15% | -19.80% |
| Sales past 5Y | 29.30% | 48.00% | 37.20% | n/a | 43.60% | n/a | 112.00% | 3.60% | 51.30% | 44.40% | 44.50% | n/a | 20.40% | n/a | n/a |
| EPS past 5Y | 101.80% | 14.40% | 50.10% | n/a | -14.90% | n/a | -58.00% | 17.30% | 22.90% | 32.00% | 44.80% | n/a | 26.50% | n/a | n/a |
| D/E | 0.59 | 0.16 | 0.09 | 0.19 | nm | 0.18 | 6.70 | 1.86 | 0.00 | nm | 1.98 | nm | 0.00 | 5.14 | 0.94 |
| Current Ratio | 1.20 | 1.70 | 1.40 | 1.80 | 1.20 | 1.60 | 3.80 | 1.30 | 0.90 | 1.40 | 4.40 | 2.70 | 1.30 | 2.20 | 3.20 |
| Quick Ratio | 1.00 | 1.80 | 1.00 | 1.11 | 1.20 | 1.20 | 1.70 | 1.30 | 0.60 | 1.40 | 4.40 | 2.40 | 1.00 | 2.20 | 2.80 |
Source: created by the author using data from finviz.com
In my opinion, the closest competitor of Alibaba is Amazon. Companies have not only similar business models but also similar financial indicators. Nevertheless, it is obvious that Amazon is more successful in its activities. Higher profit growth rates are accompanied by good profitability indicators. Perhaps this is one of the factors that gives Amazon shares a higher value in the comparative analysis.
Multipliers comparison
As a basis for comparative analysis, I selected the classic multipliers P/S, P/E, EV/S, EV/EBITDA, and forward P/E. Many of the companies presented did not have a net profit or other income, so the calculation of the indicator is not meaningful for them. In this case, P/S can be called very informative, because, for the retail industry, the key business process is to increase sales, and only then should cost savings, etc.
| Multiplier | Amazon | Alibaba | JD | Pinduoduo | MercadoLibre | Coupang | Carvana | eBay | Chewy | Wayfair | Etsy | Farfetch | VipShop | Global-E | Ozon |
| P/S | 3.83 | 4.53 | 0.89 | 9.39 | 18.92 | 0.53 | 3.6 | 4.17 | 4.93 | 1.77 | 10.64 | 8.96 | 0.7 | 9.99 | 6.78 |
| P/E | 58.82 | 23.95 | 14.15 | nm | nm | nm | nm | 17.63 | nm | 58.06 | 52.6 | nm | 11.79 | 6691.48 | nm |
| Fwd P/E | 62.83 | 20.39 | 52.8 | nm | 816.46 | nm | nm | 17.09 | 648.97 | 84.3 | 51.12 | nm | 10.42 | nm | nm |
| EV/EBITDA | 29.2 | 21.77 | 40.49 | nm | 215.03 | nm | nm | 13.86 | 1377.29 | 33.12 | 47.05 | nm | 8.46 | 805.45 | nm |
| EV/S | 3.91 | 4.36 | 0.82 | 8.82 | 16.93 | 4.77 | 4.34 | 4.5 | 4.85 | 1.79 | 11.9 | 9.07 | 0.57 | 65.93 | 6.17 |
Source: created by the author using data from finviz.com
As I mentioned above, this comparison includes several young companies. What is typical for them, they have very high multipliers (highly overvalued). Comparing with more mature companies, you can see that Alibaba looks very undervalued on both P/E compared to Amazon. Another old company, eBay, is itself undervalued compared to Alibaba. The reason for this is low growth rates, so the underestimation of eBay looks very deserved.
For more accurate results, I calculated different averages of these multipliers for the selected companies. The geometric mean seems the most accurate. According to it, Alibaba is quite undervalued. The high underestimation of multiples using earnings or EBITDA in the denominator is due to the fact that many companies with low income are represented in the list. This is essential for companies at the early growth stage, and Alibaba has already crossed this stage. Therefore, a comparative assessment cannot be called sufficiently accurate to make an investment decision.
| Multiplier | Alibaba | Average | Geometric mean | Median |
| P/S | 4.53 | 5.98 | 3.94 | 4.35 |
| P/E | 23.95 | 866.06 | 55.08 | 38.28 |
| Fwd P/E | 20.39 | 196.04 | 67.08 | 52.80 |
| EV/EBITDA | 21.77 | 259.17 | 63.83 | 36.81 |
| EV/S | 4.36 | 9.92 | 5.11 | 4.64 |
Source: created by the author using data from finviz.com
DCF Valuation
To perform a DCF valuation, I used the Alpha Spread tool but made my own adjustments to the initial indicators. I used a 5-year forecast period with 0% terminal growth.
The first adjustment was the operating margin, which I calculated as the average for the past 3 years. According to the graph that I gave above, it is clear that profitability is decreasing. But the probability that it will continue to fall in the long term is very low since the company is actively investing at the moment.
Another adjustment is the calculation of the discount rate. I used my own data to calculate the cost of equity using CAPM. As a risk-free rate, I used the US Treasury yield for 30 years, which is 1.94%. I used the Equity Risk Premium and the country risk premium for Chinese companies, estimated by Aswath Damodaran, equal to 4.97% and 0.59%, respectively. The beta version for 60 months for Alibaba is 0.87. The cost of equity is 6.85%. The WACC is estimated to be 6.69%.
| Millions USD | 2022 | 2023 | 2024 | 2025 | 2026 | Terminal |
| Revenue | 143512 | 173258 | 224231 | 273696 | 313929 | 336971 |
| Operating Margin | 0.1675 | 0.1679 | 0.1679 | 0.1679 | 0.1679 | 0.1679 |
| Operating Income | 24038 | 29090 | 37648 | 45954 | 52709 | 56578 |
| Taxes | -1010 | -2199 | -4111 | -6562 | -9298 | -11881 |
| NOPAT | 23029 | 26891 | 33537 | 39391 | 43411 | 44696 |
| Net CapEx | 3817 | 4609 | 5965 | 7280 | 8351 | 8963 |
| FCFF | 26846 | 31499 | 39502 | 46672 | 51761 | 53660 |
| Discount Rate | 0.0669 | 0.0669 | 0.0669 | 0.0669 | 0.0669 | 0.0669 |
| DCF | 25163 | 27673 | 32527 | 36021 | 37444 | 580234 |
Source: created by the author using alphaspread.com
My calculated target price of Alibaba is $283, which is 44% upside potential. It is a fair upside since the stock price dipped ~37% from the highest point of $310. The current price might be a good point of entry for the short term. Alibaba doesn’t have big financial or operational problems, the only reason to fall is the uncertainty of CCP’s actions. The company needs a positive news background as an impulse to start growing.
| Indicator | Value |
| DCF Value | 739B USD |
| +Cash & Equivalents | 49B USD |
| +Investments | 25B USD |
| Firm Value | 813B USD |
| -Debt | 23B USD |
| -Minority Interest | 21B USD |
| Equity Value | 769B USD |
| Shares Outstanding | 2,718,180,096 |
| Stock Intrinsic Value | 283.02 USD |
| Stock Market Price | 196.39 USD |
| Upside | 44% |
Source: created by the author using alphaspread.com
I would like to note that this estimate is partially made in accordance with analysts ‘ expectations for the next 5 years. I used public estimates of revenue, taxes, and CapEx.
My Thoughts On Alibaba’s Future
The current situation has turned out to be unpleasant for many long-term Alibaba investors. The prolonged decline in stocks makes us think about whether investing in Chinese companies is worth it. At the moment, I can highlight several positive and negative aspects of investing in Alibaba.
Why I still believe in Alibaba:
- In my opinion, it is clear that the company will continue to operate in the future. In addition, I see that the probability that such a giant company will be delisted or become private within the next few years is quite low.
- Another point is that some actions of CCP lead to positive changes. For example, increase in transparency in operations or competition.
- Besides, Alibaba is a growth stock, which business is really growing and brings profits. The company has good margins, low debt, and decent earnings.
- The last point is obvious. It is heavily undervalued. The company needs some positive information background to begin the growth.
Why I wouldn’t hold Alibaba (or any other Chinese company) for the long-term:
- It is all about uncertainty. It is a common opinion that the financial reports of Chinese companies are a black box. You can never be sure how many times it was corrected.
- For Chinese companies, it is more difficult to enter foreign markets. Alibaba has a strong competitor in international retail, which is Amazon. The domestic market is already well penetrated. The internet penetration in China is over 70%, and it seems like almost everyone in China who uses the internet buys from Alibaba at least once a year. Therefore, the growth in the domestic market is limited in the long term.
- A lot of problems fell on Alibaba during the past year. It seems like the Chinese government decided to state all claims to the company at once. In the long term, new sanctions may appear, because of the huge political risk.
Investing in Chinese companies is obviously riskier than in US ones, but also it is a chance to benefit from the rapid growth of the Chinese economy. Of course, how long it will continue is a big question. But it is almost clear, that during the following 1-3 years China will grow as fast as it used to.
The Bottom Line
Using DCF valuation I estimated Alibaba’s upside potential at the level of approximately 44%. The estimated target price is $283 per share.
In my opinion, the current price of Alibaba is a great opportunity for short-and mid-term investors. There are a lot of risks to be concerned about, however, I reckon the company will successfully overcome this crisis of Chinese regulation. At the moment, the strong fall in the share price is more due to fears than facts. Most of the significant problems that may affect Alibaba’s business are of a long-term nature. The probability of their appearance in the short term is quite small. Therefore, I see Alibaba as a good short-term investment with the potential to recover the share price to previous levels.
Author: Gleb Krivosheev, Seeking Alpha