

Zai Lab: Best Now Capital Gain Biotech For Near-Term Wealth-Building, So Say Market-Makers

Summary
- Like it or not, capital gain prospects for stocks in U.S. equities markets are all directly comparable with one another, and investors who want those gains need to make comparisons.
- The comparability comes from big-money transaction pressures by competing “Institutional” investment organizations adjusting multi-Billion-$ portfolio holdings.
- Transactions negotiated among Institutions by Market-Makers usually require the MMs risking firm capital – risks not taken without hedging costs accepted by the trade order originator.
- That hedging in leveraged “derivative” securities defines how far (both upside and downside) the subject stock’s price is likely to go – worth paying a price to protect against.
- How equities markets have reacted to those Risk~Reward tradeoffs provides an opportunity shopping list.

Investment Thesis
Best-informed investment professionals are at firms making markets for institutions which need continuing adjustments in holdings of multi-billion-dollar portfolios. Those firms employ over 100,000 worldwide 24×7 observers of all kinds of competitors.
Their ongoing reports to NYC HQ offices at firms like Goldman Sachs, Morgan Stanley and others sharpen market-making negotiators between buyers and sellers of shares wanting to move big blocks of stocks.
To do that quickly and quietly usually requires the MMs to balance with the firm’s own capital available the interest in the “other side of the trade” order placed by their big-$ client. They can, by becoming a principal temporarily in the trade instead of just an agent. But the MMs won’t do that without a separate hedging deal which protects their capital against the risk of price changes while they are involved.
The terms and cost of the hedge deal reveal how far both the buyer and seller of the price-change “insurance” think the price of the stock may go, defining a forecast of the risk and reward involved in the original block trade order.
This article compares Zai Lab Limited (ZLAB) to a few of its closest almost as attractively priced biotech competitors.
This analysis only compares the attractiveness of those deals’ forecasts with other alternative stocks’ similar forecasts. No appraisal is intended as to the scientific capabilities or business performance of the investment subject corporations.
Business Description
Zai Lab Limited, a biopharmaceutical company, develops and commercializes therapies to treat oncology, autoimmune disorders, and infectious diseases primarily in Greater China, including mainland China, Hong Kong, Macau, and Taiwan. It has license and collaboration agreements with GlaxoSmithKline (NYSE:GSK); Paratek Bermuda, Ltd.; Five Prime Therapeutics, Inc. (NASDAQ:FPRX); Entasis Therapeutics Holdings, Inc. (NASDAQ:ETTX); Crescendo Biologics Ltd.; NovoCure Limited (NASDAQ:NVCR); MacroGenics Inc. (NASDAQ:MGNX); Deciphera Pharmaceuticals, LLC (NASDAQ:DCPH); Incyte Corporation (NASDAQ:INCY); Regeneron Ireland Designated Activity Company; Turning Point Therapeutics Inc (NASDAQ:TPTX); Cullinan Pearl Corp.; Takeda Pharmaceutical Company Limited (NYSE:TAK); and argenx BV. The company was incorporated in 2013 and is headquartered in Shanghai, China.

source: Yahoo Finance
The big picture: Risks vs. Rewards
Figure 1
(used with permission)
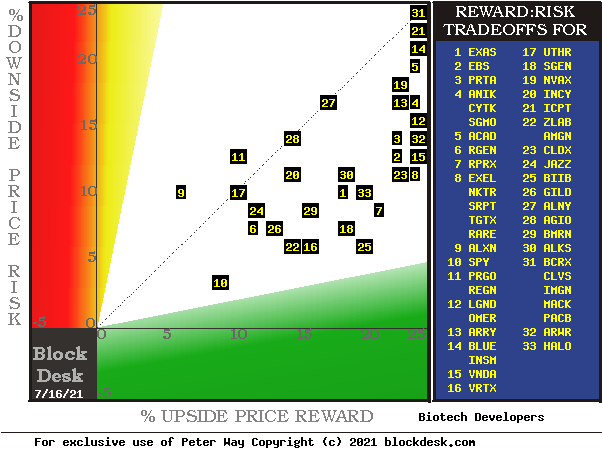
The tradeoffs here are between near-term upside price gains (green horizontal scale) seen worth protecting against by Market-Makers with short positions in each of the stocks, and the prior actual price drawdowns experienced during holdings of those stocks (red vertical scale). Both scales are of percent change from zero to 25%. Good location for long positions is down and to the right.
The intersection of those coordinates by the numbered positions is identified by the stock symbols in the blue field to the right.
The dotted diagonal line marks the points of equal upside price change forecasts derived from Market-Maker [MM] hedging actions, and the actual worst-case price drawdowns from positions that could have been taken following prior MM forecasts like today’s.
Our principal interest is in ZLAB at location [22]. A “market index” norm of Reward~Risk tradeoffs is offered by SPY at [10].
These forecasts are implied by the self-protective behaviors of MMs who must usually put firm capital at temporary risk to balance buyer and seller interests in helping big-money portfolio managers make volume adjustments to multi-billion-dollar portfolios. Their protective actions define daily the extent of likely expected price changes for thousands of stocks and ETFs.
This map is a good starting point, but it can only cover some of the investment characteristics that often should influence an investor’s choice of where to put his/her capital to work. The table in Figure 2 covers the above considerations and several others.
Comparing Alternative Investments
Figure 2

(used with permission)
source: Author, blockdesk.com
Regular readers familiar with our analysis may want to skip to Specific Alternative stocks
The price-range forecast limits of columns [B] and [C] get defined by MM hedging actions to protect firm capital required to be put at risk of price changes from volume trade orders placed by big-$ “institutional” clients.
[E] measures potential upside risks for MM short positions created to fill such orders, and reward potentials for the buy-side positions so created. The buy-side risks actually encountered from prior forecasts like the present are in [F], as the most severe loss moments encountered during holding periods in effort to reach [E] gains. Those are where buyers are most likely to accept losses.
[H] tells what proportion of the [L] sample of prior like forecasts have earned gains by either having price reach its [B] target, or be above its [D] entry cost at the end of a 3-month max-patience holding period limit. [ I ] gives the net gains-losses of those [L] experiences and [N] suggests how credible [E] may be compared to [ I ].
Further Reward~Risk tradeoffs involve using the [H] odds for gains with the 100 – H loss odds as weights for N-conditioned [E] and for [F], for a combined-return score [Q]. The typical position holding period [J] on [Q] provides a figure of merit [fom] ranking measure [R] useful in portfolio position preferencing. Figure 2 is row-ranked on R among candidate securities, with ZLAB in top rank.
Specific Alternative stocks
ZLAB now offers an unusually high fom because of an unusual one-day price drop. Its price declined 8% while its upside forecast only gave up 6% and its downside narrowed by 11% from a RI of 31 to 20. Its competitor investment, TG Therapeutics (TGTX), only edged off ½% in price, remaining significantly behind ZLAB in bp/day at 40+, compared to ZLAB’s 62+. Seattle Genetics (SGEN) remains far behind at 22bp/day.
Please keep in mind that +100% annual rate of gain equates to 19 bps/day, so ZLAB’s +20% realized gain in 31 days is a huge accomplishment to expect.
When compared to the average bps/day achieved by the best 20 stocks out of the 3,500 in the population of MM price range forecasts, ZLAB’s gains are more than half again larger. Here is how the MM price range forecasts have been trending for ZLAB.
Subject Stock Trend of Forecasts
Figure 3

(used with permission)
Please note the frequency distribution of daily Range Indexes close above this text, and the proportion of those in the past 5 years at levels higher than the RI 20 now noted.
Conclusion
The appearance of Zai Lab, Ltd. (ZLAB) at such potential near-term gains makes it an attractive investment prospect.
Author: Peter F. Way, CFA, Seeking Alpha